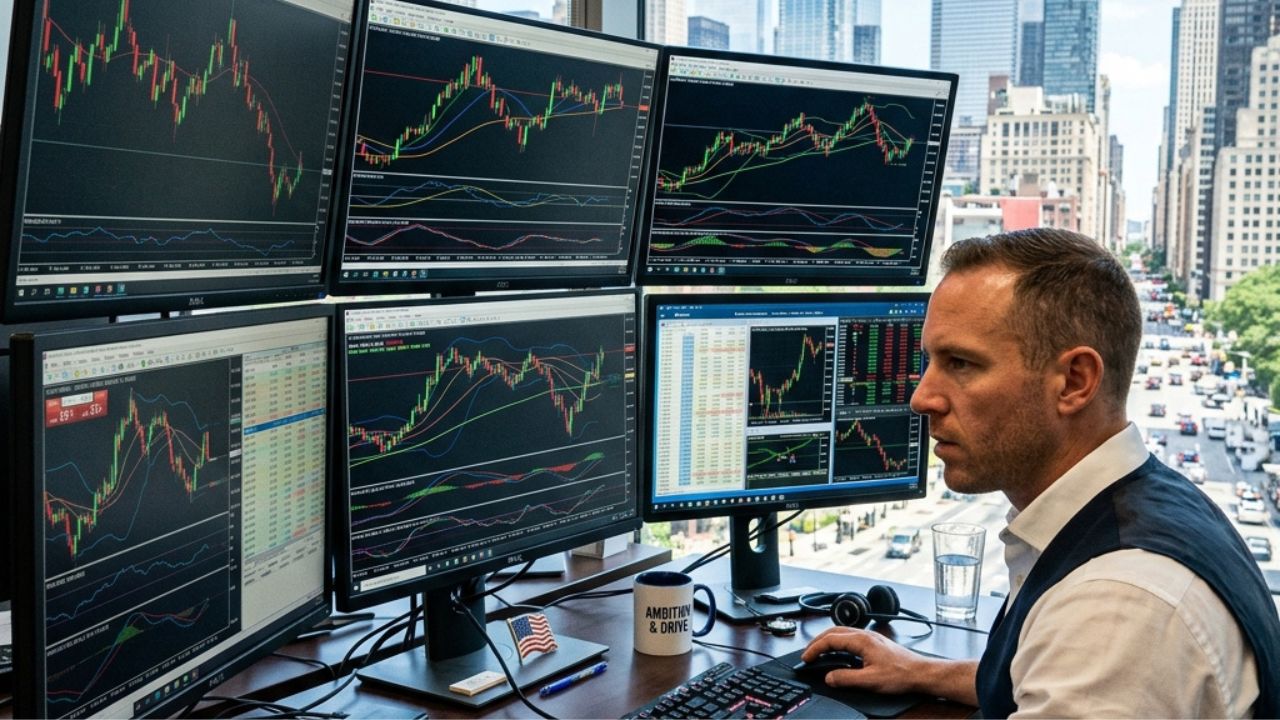
The top Forex indicators for US investors include momentum indicators like the Relative Strength Index (RSI) and the Moving Average Convergence Divergence (MACD), alongside trend tools like Moving Averages and Bollinger Bands. Combining these specific technical indicators helps traders identify market trends, measure market volatility, and make data-driven decisions while managing financial risk.
The foreign exchange (Forex) market operates 24 hours a day, five days a week, standing as the largest and most liquid financial market in the world. For US investors, the Forex market offers substantial opportunities to diversify portfolios beyond traditional domestic stocks and bonds. Currency trading involves buying one currency while simultaneously selling another, aiming to profit from fluctuations in exchange rates driven by global economic events, interest rates, and geopolitical shifts.
However, navigating the complexities of global currency pairs requires more than just a basic understanding of international news. US investors need reliable, objective methods to analyze price movements and predict future market behavior. This is where Forex indicators become essential. These mathematical calculations, based on historic price, volume, or open interest information, help traders identify patterns, confirm trends, and generate buy or sell signals.
By integrating the right technical indicators into a comprehensive trading strategy, US investors can remove emotional decision-making from their trades and base their market entries and exits on quantifiable data.
Disclaimer: The information provided in this article is for educational purposes only and does not constitute financial advice. Forex trading carries a high level of risk and may not be suitable for all investors. Always conduct your own research or consult with a licensed financial advisor before making investment decisions.
What are technical indicators in Forex trading?
Technical indicators are mathematical tools that analyze historical data—primarily price and volume—to forecast future price movements in the Forex market. Traders apply these indicators directly to their price charts to visualize market psychology, measure momentum, and identify the underlying trend of a specific currency pair, such as the EUR/USD or USD/JPY.
What is the difference between leading and lagging Forex indicators?
Technical indicators generally fall into two broad categories: leading indicators and lagging indicators.
Leading indicators are designed to anticipate future price movements before they actually happen. They provide early signals for potential market reversals or breakouts. However, because they attempt to predict the future, leading indicators are prone to generating false signals, especially in highly volatile markets. Examples of leading indicators include the Relative Strength Index (RSI) and the Stochastic Oscillator.
Lagging indicators, on the other hand, follow price movements. They do not predict future trends but rather confirm a trend that has already begun. While lagging indicators provide more reliable signals, they come with a delay, meaning traders might miss the initial portion of a price move. Moving Averages (MA) and the Moving Average Convergence Divergence (MACD) serve as primary examples of lagging indicators.
Choose a leading indicator if you prioritize early entry into potential new trends and can tolerate a higher risk of false signals. Choose a lagging indicator if confirming the trend direction matters more than capturing the absolute bottom or top of a market move.
How can US investors use technical indicators effectively?
To use technical indicators effectively, US investors must avoid cluttering their trading charts with too many tools. Applying five different indicators that all measure momentum will only lead to redundant information and “analysis paralysis.” Instead, traders should select a small, complementary group of indicators that serve different purposes—for example, combining one trend-following indicator with one momentum indicator and one volatility indicator.
What are the key momentum indicators for US Forex traders?
Momentum indicators measure the speed or rate of change in the price of a currency pair. They help US Forex traders determine whether a current trend is accelerating or losing steam, which often signals an impending reversal.
How does the Relative Strength Index (RSI) work?
The Relative Strength Index (RSI) is a prominent momentum oscillator that measures the speed and change of price movements. Developed by J. Welles Wilder, the RSI oscillates between 0 and 100.
Traders primarily use the RSI to identify overbought and oversold conditions in a Forex pair. When the RSI reading crosses above 70, the market is generally considered overbought, suggesting that the currency pair may be due for a downward correction. Conversely, an RSI reading below 30 indicates an oversold condition, hinting at a potential upward price reversal.
Beyond overbought and oversold levels, US investors utilize the RSI to spot divergences. A bullish divergence occurs when the price records a lower low, but the RSI forms a higher low, signaling that downward momentum is weakening. A bearish divergence happens when the price hits a higher high, but the RSI prints a lower high, indicating fading upward momentum.
What is the Moving Average Convergence Divergence (MACD) indicator?
The Moving Average Convergence Divergence (MACD) is a trend-following momentum indicator that shows the relationship between two moving averages of a currency pair’s price. The MACD consists of three components: the MACD line, the signal line, and the MACD histogram.
The MACD line is calculated by subtracting the 26-period Exponential Moving Average (EMA) from the 12-period EMA. The signal line is a 9-period EMA of the MACD line itself. The histogram represents the distance between the MACD line and the signal line.
US investors typically look for MACD crossovers to generate trading signals. A bullish signal occurs when the MACD line crosses above the signal line, suggesting upward momentum. A bearish signal triggers when the MACD line crosses below the signal line. Additionally, the MACD is highly effective for identifying divergence, similar to the RSI, offering powerful clues about trend exhaustion.
How can traders use the Stochastic Oscillator?
The Stochastic Oscillator is another momentum indicator that compares a particular closing price of a currency pair to a range of its prices over a specific period. The indicator consists of two lines: the %K line (the current market rate) and the %D line (a moving average of the %K line).
Like the RSI, the Stochastic Oscillator fluctuates between 0 and 100, highlighting overbought and oversold levels. Readings above 80 indicate an overbought market, while readings below 20 suggest an oversold market. Traders watch for the %K line to cross the %D line within these extreme zones to identify high-probability reversal points. Choose the Stochastic Oscillator over the RSI if you are trading in a choppy, sideways market, as it tends to be more responsive to short-term price fluctuations.
What are the essential trend indicators for identifying Forex market direction?
Trend indicators smooth out price data to help US Forex traders clearly see the dominant direction of the market. Trading in the direction of the underlying trend generally offers higher probability setups than trading against it.
How do Moving Averages (MA) help traders spot trends?
Moving Averages (MA) are the most fundamental trend indicators in Forex trading. They calculate the average price of a currency pair over a specified number of periods. The two most common types are the Simple Moving Average (SMA) and the Exponential Moving Average (EMA).
The SMA calculates the average price by adding the closing prices over a set period and dividing by that number of periods. The EMA applies more weight to recent prices, making it react faster to current market changes.
US investors use Moving Averages to determine the overall trend direction. If the price remains above a rising MA, the trend is bullish. If the price stays below a falling MA, the trend is bearish. Traders also monitor for specific crossover events, such as the “Golden Cross” (when a short-term MA crosses above a long-term MA, signaling a major bull trend) and the “Death Cross” (when a short-term MA crosses below a long-term MA, indicating a major bear trend).
What do Bollinger Bands reveal about Forex volatility?
Developed by John Bollinger, Bollinger Bands consist of three lines plotted on a price chart: a middle band (usually a 20-period SMA), an upper band, and a lower band. The upper and lower bands are typically set two standard deviations away from the middle band.
Bollinger Bands measure market volatility. When the Forex market becomes highly volatile, the bands widen. When the market consolidates and volatility drops, the bands contract. US Forex traders often look for a “squeeze” pattern, where the bands contract tightly around the price. A squeeze suggests that a period of low volatility is ending and a significant price breakout is imminent. Furthermore, prices frequently bounce between the upper and lower bands in a ranging market, allowing traders to buy near the lower band and sell near the upper band.
How do you interpret the Ichimoku Kinko Hyo cloud?
The Ichimoku Kinko Hyo, often simply called the Ichimoku Cloud, is a comprehensive technical indicator that provides insights into trend direction, momentum, and support/resistance levels all at once.
The most prominent feature of this indicator is the Cloud (Kumo). If the current price is trading above the Cloud, the overall trend is bullish, and the Cloud acts as a dynamic support level. If the price is below the Cloud, the trend is bearish, and the Cloud acts as dynamic resistance. The indicator also utilizes several specific moving averages (the Tenkan-sen and Kijun-sen) to generate crossover signals, making it an all-in-one system for dedicated technical analysts.
Which volume and volatility indicators are best for Forex trading?
While momentum and trend indicators focus on price direction, volume and volatility indicators help US investors understand the force behind a price move and the potential range of future movements.
How does the Average True Range (ATR) measure market volatility?
The Average True Range (ATR) is a technical indicator introduced by J. Welles Wilder that measures market volatility by decomposing the entire range of an asset price for a given period. It does not provide indications of price direction; rather, it exclusively measures historical volatility.
For US investors, the ATR is an invaluable tool for risk management. By understanding the average pip movement a currency pair makes in a day or week, traders can set logical stop-loss orders. For instance, placing a stop-loss order slightly outside the current ATR value ensures that normal daily market fluctuations will not prematurely close a trade.
What is On-Balance Volume (OBV) and how does it confirm price trends?
In the decentralized Forex market, true global volume is difficult to measure. However, platforms often use tick volume as a proxy. On-Balance Volume (OBV) uses this volume flow to predict changes in price.
The OBV adds volume on up days and subtracts volume on down days. When the OBV line rises alongside the price, it confirms the upward trend, showing strong buying pressure. If the price increases but the OBV line falls, it signals a negative divergence, suggesting that the trend lacks the necessary volume to sustain itself and a reversal may be approaching.
How can US investors incorporate technical indicators into a trading strategy?
Successful Forex trading requires more than just knowing what indicators do; it requires synthesizing them into a coherent strategy. US investors should combine multiple indicators to confirm signals. For example, a trader might use a 200-period SMA to determine the long-term trend, wait for the MACD to signal a momentum shift in the direction of that trend, and use the ATR to determine the appropriate stop-loss distance.
Adapting to different market conditions is equally critical. Use trend indicators like Moving Averages during trending markets, and rely on oscillators like the RSI and Stochastic Oscillator during ranging, sideways markets. Proper risk management and position sizing must always accompany technical analysis to protect trading capital over the long term.
What are the best trading platforms and tools for US Forex investors?
US Forex traders must navigate specific regulatory environments, meaning they need reliable, compliant trading platforms. Popular platforms that fully support the technical indicators mentioned in this guide include MetaTrader 4 (MT4), MetaTrader 5 (MT5), TradingView, and thinkorswim by TD Ameritrade (Charles Schwab).
TradingView, in particular, offers extensive charting capabilities and allows users to program custom indicators using its Pine Script language. For continuous learning, US investors should utilize resources like Babypips.com for foundational knowledge and practice executing trades on risk-free demo accounts before committing real capital.
What common trading mistakes should Forex investors avoid?
Even with the best indicators, US investors often fall into predictable traps.
The most common mistake is over-reliance on a single indicator. No technical tool is 100% accurate. Relying solely on the RSI to blindly buy every time a market hits the oversold level will inevitably lead to significant losses during a strong downtrend.
Another major error is ignoring fundamental analysis. Technical indicators react to price action, but macroeconomic events—such as Federal Reserve interest rate decisions, Non-Farm Payroll (NFP) reports, and geopolitical conflicts—drive that price action.
Finally, a lack of backtesting undermines many traders. Before risking real money, investors must backtest their indicator-based strategies against historical Forex data to verify their effectiveness and build confidence in their trading system.
Next steps for mastering Forex technical indicators
Mastering the Forex market as a US investor requires patience, discipline, and a thorough understanding of technical analysis. By mastering key momentum indicators like the RSI and MACD, alongside trend tools like Moving Averages and Bollinger Bands, you equip yourself with the objective data needed to make informed trading decisions.
Remember that no indicator is flawless. Continuous learning, rigorous backtesting, and strict risk management dictate long-term success. Start by selecting two or three complementary indicators, test them on a demo account, and slowly build a strategy that fits your specific risk tolerance and trading style.
Frequently asked questions about Forex indicators
What is the most accurate technical indicator for Forex trading?
No single Forex indicator is entirely accurate on its own. The most effective approach involves combining a trend-following indicator (like Moving Averages) with a momentum oscillator (like the MACD) to confirm trading signals and filter out false breakouts.
Can US investors use the same indicators for all currency pairs?
Yes, technical indicators like the RSI, Bollinger Bands, and ATR function across all currency pairs. However, their specific settings (like the period length) may need adjustment depending on the inherent volatility of the specific pair, such as the highly volatile GBP/JPY compared to the more stable EUR/CHF.
How much money do I need to start Forex trading in the US?
While some regulated US Forex brokers allow accounts to be opened with as little as $100, experts generally recommend starting with at least $1,000 to $2,500. This capital size allows traders to implement proper risk management strategies and utilize micro-lots without immediately triggering margin calls.
Are Forex indicators better for day trading or swing trading?
Forex indicators apply to all timeframes, making them suitable for both day trading and swing trading. Day traders use lower timeframes (like the 5-minute or 15-minute charts) for rapid signals, while swing traders apply the same indicators to daily or weekly charts to capture larger, long-term market trends.